Send $200 from the US to Mexico and the average total cost is 4.54% of the amount sent. Send that same $200 from South Africa to Malawi, two neighboring countries on the same continent, and the average total cost is 31.48%, according to World Bank data from the third quarter of 2025. Both transfers are the same amount and are meant to have the same currency conversion. The transfer from South Africa to Malawi is even a fraction of the distance in some cases, and yet it costs roughly seven times more than the other.
Nothing about the sender or the recipient explains such a big discrepancy in pricing. What explains it is the itself, the specific pair of countries the money is moving between, and everything about market structure, infrastructure, and regulation that differs from one corridor to the next.
Dashed line: the UN target of 3% by 2030. Scale runs to 35%. World Bank RPW corridor averages. One is 6.9 times the other.
Seven factors decide why one corridor is expensive and another is cheap: competition, correspondent-banking relationships, currency liquidity, regulation, geography, payment infrastructure, and cash-distribution networks. In general, the cost of a transfer is not determined by the transfer itself, but rather the corridor.
Competition
The single biggest driver of price on any corridor is how many are actually competing for the business. The corridors with the lowest costs in the world tend to be ones with enormous migrant populations and a correspondingly large number of banks, , and digital providers all fighting for the same customers. UAE to India, one of the cheapest corridors on record, costs around 1.5%. Saudi Arabia to Pakistan runs about 2.1%. These are high-volume corridors serving huge populations, and that volume attracts enough competing providers that prices get pushed down close to the actual cost of moving the money.
Contrast that with a corridor like South Africa to Malawi, or South Africa to Botswana, which averaged 16.45% in the same World Bank dataset. Intra-African corridors are frequently described in industry research as dominated by a small number of banks with little competitive pressure, rather than the dense, competing marketplace that keeps Gulf corridors cheap. Fewer providers competing for the same transfer means less pressure on any of them to lower their price, forcing the sender to cover the difference.
Dashed line: the UN target of 3% by 2030. Scale runs to 35%. Hollow bars are figures the post's source gives as approximate. Same scale as the figure above, so the three can be read against Malawi.
Correspondent-Banking Relationships
An earlier post in this series covered how bridge two banks that have no direct relationship with each other. What that post didn't cover is that these relationships aren't evenly distributed around the world. These relationships have also been shrinking around the world. This trend has a name in banking circles: .
Large global banks have been pulling back from correspondent relationships with smaller banks in higher-risk or lower-revenue markets, largely because the compliance cost of maintaining any single relationship, the ongoing due diligence, checks, and regulatory reporting, is roughly fixed no matter how much money actually flows through it. For a correspondent bank sitting in a large financial center, a relationship with a small bank in a smaller economy often isn't worth the fixed compliance overhead relative to what it earns.
Data from showed South Africa losing more than 10% of its foreign banking counterparties between 2013 and 2015, and Angola losing 37% of its foreign counterparties over a similar two-year window. A World Bank survey from the same period found that more than half of banks in Africa reported a moderate or significant decline in their correspondent relationships.
Fewer correspondent relationships means a payment has to route through more intermediary hops to get where it's going, and every extra hop is another opportunity for a fee to be added, exactly the mechanism the earlier post in this series described, just applied unevenly depending on which corridor a transfer happens to be crossing.
SWIFT data, as reported at Sibos 2016. The whole bar is the counterparties a country's banks had in 2013; the filled part is what was left two years on.
Currency Liquidity
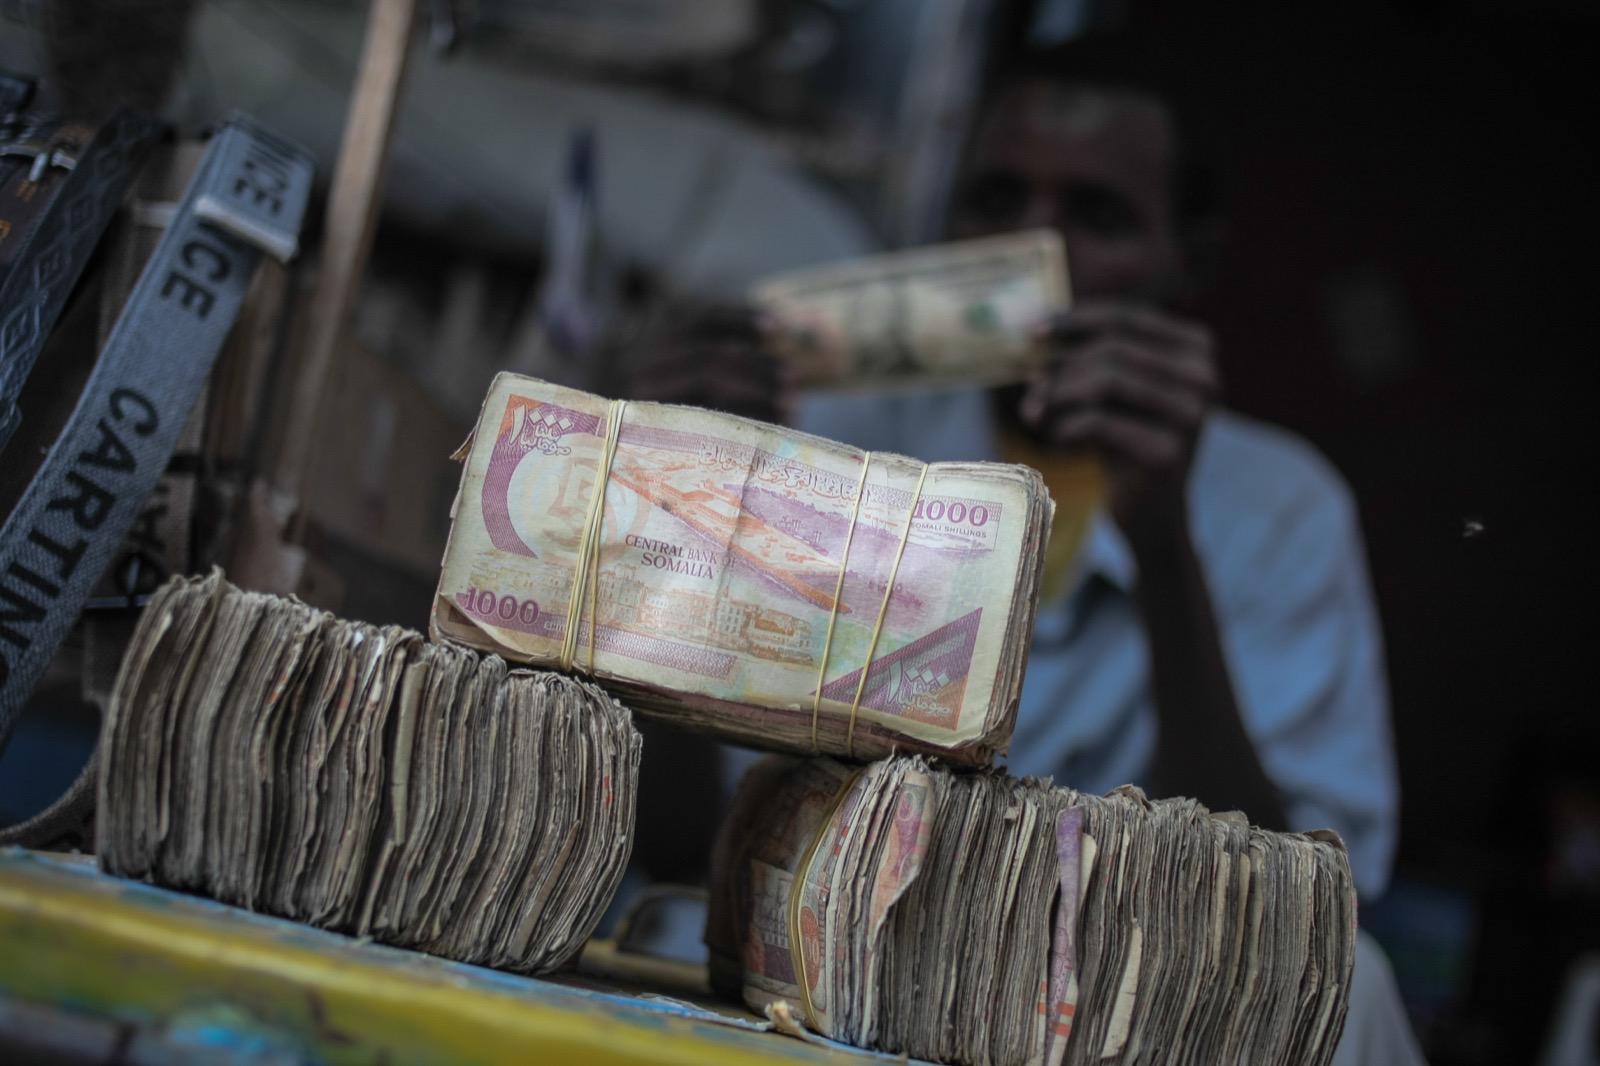
Not every currency trades the same way. The Mexican peso and the Indian rupee are heavily traded on global currency markets, which means a provider converting dollars into either of them can do so cheaply, quickly, and at a rate very close to the real market price. A currency like the Malawian kwacha or the Ugandan shilling trades in far smaller volumes globally, which makes it harder and more expensive for a provider to access the amount of that currency it needs, hedge against its price moving, or offload it afterward.
Providers pass that difficulty straight through to the exchange rate they offer, which is exactly the component covered in the previous post in this series. A on one end of a corridor is often enough, on its own, to make that corridor's exchange rate margin wider than a corridor built around two heavily-traded currencies.
Regulation
Every country sets its own rules for who is allowed to move money across its border. The issue, though, is that these rules vary enormously. Some countries maintain or foreign exchange restrictions that limit how freely money can enter or leave, adding friction and cost on top of whatever a provider is otherwise charging. Others require remittance providers to hold a specific local license before they're allowed to operate at all, which caps how many providers can legally compete on that corridor no matter how much demand exists.
And the compliance requirements tied to anti-money-laundering rules, largely a fixed cost regardless of transfer size, hit corridors with smaller transaction volumes disproportionately hard, the same underlying dynamic driving the correspondent-banking withdrawal described above. A corridor operating under lighter, more standardized regulation on both ends simply has fewer built-in costs to begin with.
Geography
Physical distance matters less here than physical accessibility. A landlocked country, or one with a large rural population spread far from major cities, is more expensive to serve on the receiving end, because someone still has to physically get cash to wherever the recipient actually is. Malawi and Uganda, both landlocked, both appearing among the more expensive corridors in the World Bank's data, illustrate this directly: geography alone adds a layer of delivery cost that a corridor ending in a dense, well-connected urban center doesn't have to absorb.
Money arrives
in the country
Capital city
bank or agent hub
Regional town
cash moved by road
Village agent
if there is one
Recipient
collects in cash
last mile
Dense, urban: the first box and the last, with nothing between them.
Landlocked, rural: every box, and every one is a cost.
Payment Infrastructure
Whether a corridor has functioning digital already built into it changes its cost structure dramatically. World Bank data consistently shows as the cheapest way to send a remittance, averaging 3.63% in early 2025, while banks remain the most expensive channel by a wide margin, averaging 14.55% in the same period. A corridor ending in a country with strong mobile money adoption can route transfers through that infrastructure and land close to the mobile-money average. A corridor without that infrastructure has no choice but to fall back on slower, costlier bank transfers or cash-based delivery, and the recipient country's infrastructure, not the sender's, is usually the deciding factor in which situation a given corridor ends up in.
Dashed line: the UN target of 3% by 2030. Scale runs to 16%. World Bank RPW main report. Banks are 4.0 times mobile money.
Since payment infrastructure is such a big factor in determining remittance costs, our organization is focused on finding cheaper ways to send remittances through blockchain networks. Check out more of our blogs or our research papers for specific findings.
Cash-Distribution Networks
Even once a transfer arrives digitally, plenty of recipients still collect their money as physical cash, and somebody has to run the network of agents, kiosks, and branches that makes that possible. In corridors with a dense, competitive network of locations, that competition keeps pickup commissions in check. In corridors where only one or two providers have built out a physical agent network, often true of intra-African corridors dominated by a small number of large banks, that scarcity gives those providers real pricing power over the last mile of the transaction, with no competing network forcing the price back down.
Same Transfer, Different World
None of these seven factors have anything to do with how much money is being sent or who's sending it. They're all properties of the corridor itself, how many providers compete on it, whether the correspondent banking relationships to support it still exist, how liquid its currencies are, how it's regulated on both ends, how accessible its geography is, whether digital payment infrastructure already reaches the recipient, and how dense the cash-distribution network is if it doesn't.
A family sending $200 from South Africa to Malawi isn't paying seven times more than a family sending the same $200 from the US to Mexico because their transfer is worth more or riskier to process. They're paying more because the market they're forced to send through was built, or in some cases abandoned, under completely different conditions than the one next door. This is the structural gap RemitBridge aims to educate about, and hopes to provide solutions for.
1. Competition
2. Correspondent-banking relationships
3. Currency liquidity
4. Regulation
5. Geography
6. Payment infrastructure
7. Cash-distribution networks
Sources
- 1.World Bank, Remittance Prices Worldwide Q3 2025 data, on South Africa-Malawi, South Africa-Botswana, and South Africa-Zimbabwe corridor costs, and on US-Nigeria and US-Mexico corridor costs: remittanceprices.worldbank.org
- 2.World Bank, Remittance Prices Worldwide Q1 2025 main report, on regional cost averages, mobile money as the lowest-cost instrument (3.63%), and banks as the most expensive channel (14.55%): remittanceprices.worldbank.org/sites/default/files/rpw_main_report_and_annex_q125_1_0.pdf
- 3.International Money Transfer, "Money Transfer Statistics 2025," on the cheapest global corridors (UAE-India, Saudi Arabia-Pakistan) and Sub-Saharan Africa's cost drivers: internationalmoneytransfer.com/guides/statistics
- 4.Send Money Africa report, on intra-African corridors dominated by a small number of banks and the South Africa-Malawi and South Africa-Mozambique cost data: mfw4a.org, "Send Money Africa Report"
- 5.FinTech Futures, "Sibos 2016: De-risking in Africa," on SWIFT data showing South Africa's and Angola's loss of foreign correspondent counterparties: fintechfutures.com
- 6.IMF, "Withdrawal of Correspondent Banking Relationships: A Case for Policy Action," on the World Bank's 2015 survey finding a majority of African banks reporting declining correspondent relationships: imf.org
- 7.Kora, "Why Cross-Border Payments in Africa Are Still Broken," on de-risking's fixed compliance costs and its disproportionate impact on smaller markets: korahq.com/blog/why-cross-border-payments-in-africa-are-still-broken
Corridor Variations · FX Liquidity